Adoption Record
You use Adoption models (sometimes called Diffusion models or S-curves) to forecast the adoption of new products or technologies. These models are useful for long-range forecasting where product lifecycle effects are prominent.
An Adoption record projects the number of units that will be sold over a set period. For example, a new product starts to sell slowly due to several factors, then a rapid growth period follows, and finally, sales slow due to market saturation.
You usually add Adoption records to CCH Tagetik Supply Chain Planning to use as adjustments to one or more time-series forecasts for a product line.
Adoption records can contain some or all of the following sections:
- Bill of Materials section
See BOM Part Record in Classic Mode. - Historical Data section
See Add Historical Data to Records. - Adoption section - Analysis Section - Comparable Items section
See Supplement Historical Data with Comparable Data. - Adjustments and Overrides Section
To configure an Adoption record
- If necessary, in the Historical Data section, type the historical data into the table.
In cases in which you are forecasting the adoption for a new product that does not have historical data, you can ignore the Historical Data section and configure the remaining parameters to forecast adoption.
Adoption Record Parameters
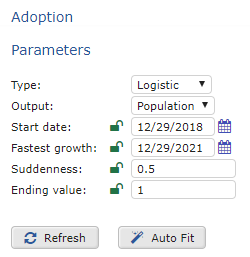 2. In the Adoption section, set the following parameters:
Adoption Record Parameters
| Parameter | Procedure |
|---|---|
| Type | Select one of the following Adoption model types: - Logistic: This symmetric S-curve is based on the idea that the probability of an individual adopting the curve is proportional to the number who already have. - Gompertz: This curve is characterized by a faster initial rise and slower final saturation than the Logistic curve. - Bass: The Bass formula derives from the idea that the population can be divided into: - Innovators: Those whose adoption rates start out high and falls exponentially. - Imitators: Those whose adoption rates are proportional to the number of people who have already adopted. The Bass formula requires a start date that is not explicitly exposed as an input parameter. Instead, the first period in your historical data is used as the start date. |
| Output | Select an output type: - Population: Gives you the total number of users in each period (installed base). This is a direct application of the S-curve formulas. - Change: Represents the change in population between periods (current demand). The change curve looks more like a bell than an S, but it is consistent with the S-curve formulas. |
| Start date | Select a date on which the model starts. |
| Fastest growth | Select the date when the S-curve rises most quickly. |
| Suddenness | Type a value to control how steeply the S-curve rises. |
| Ending value | Type the value the curve will reach when the population is fully saturated. This is probably the most important parameter to lock, especially if the quantity you are forecasting has not yet passed its Fastest growth date. |
| 3. Select one of the following: |
Adoption Record Setup Options
| Option | Description |
|---|---|
| Refresh | Apply the configuration to the forecast. |
| Auto Fit | Have CCH Tagetik Supply Chain Planning automatically fit the parameters to the Penetration model curve. Auto Fit helps you find the S-curve parameters that best fit your historical data. To use Auto Fit 1. In the Type list, select a curve. 2. Type any values you do not want the system to optimize and click the Lock icon () next to these values. 3. Click Auto Fit. The system optimizes all unlocked parameters. The Ending value may be the most important value to lock, especially if the quantity you are forecasting has not yet passed its Fastest growth date. |
| 4. In the upper-right of the screen, click OK. | |
| 5. To save your changes to the database, on the menu, click Save All Changes. |