Supplement Historical Data with Comparable Data
You can supplement the limited historical data of a forecast record with the historical data of a group of comparable records. To do this, you specify which records to use by identifying the scope of the comparable data, such as all records in the Hardware family in the North East market. You configure the scope by selecting the property values shared by all comparable records, for example:
- Family="Hardware"
- Market="North East"
- SKU number
These properties are defined by your Administrator.
See Forecast with Sparse Historical Data.
Example: Selling an existing product in a new store
You want to build a forecast for an existing product you want to sell in a new store, but you have limited historical data. You can build your forecast by supplementing the limited historical data with the historical data for the same product sold across all your other stores. This creates a comparable data set. Now the new store forecast can use the comparable data set and scale its forecast according to the existing data for the product in the new store. For example, if, according to its limited amount of historical data, the new store has a high volume of customers, the comparable data set scales to that customer volume.
The Comparable method lets you more accurately forecast how a product will sell because the comparable historical data you leverage is scaled according to the specific data for that product. Using comparable forecasting, for example, you might tell the forecast engine to "Forecast demand for SKU100 in Virginia LIKE SKU100 in all states." The historical data for SKU100 in all states is used to create the forecast for SKU100 in Virginia, but the data is scaled according to the existing historical data you have for SKU100 in Virginia.
If you apply the Top-down Aggregate and Allocate method in the example above, the result is a forecast that does not accurately reflect the true nature of your product’s performance. Aggregate and Allocate fail to account for unique patterns and trends in the historical data from the other, different stores. They also fail to scale the total product data to the size or unique characteristics of the new store.
Comparable forecasting is the best method to apply in this case because it looks for unique characteristics and scales the forecast based on data specific to the product you are trying to forecast. The result is a more accurate forecast, which gives you confidence to make decisions with regard to the product and its performance at the new store.
To supplement data with comparable data
- Open the record containing the historical data you want to supplement.
See Open and View Records.
2. In the Comparable Items section, click the Define Group icon ( ).
).
Define Group Screen
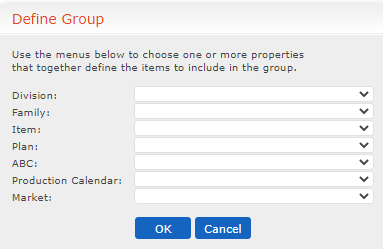 3. In the Define Group screen, select the items to use in the comparable data set and click OK.
The fields that display in the Define Group screen were defined as Menu types in the Admin screen. To have fields added, contact your CCH Tagetik Supply Chain Planning Administrator.
When you use comparable data, the historical data for all items in the comparable data group is averaged and scaled to create an alternate historical data time series. This time series displays in the forecast graph as a green line.
Here's an example so you can see how the comparable formula is working behind the scenes. Susan wants to start a cookie business. She's going to start with two kinds of cookies and sell them at her local farmer's market. She's pretty successful (yeah Susan!). Now she wants to add a third kind of cookie and is wondering how many she should bake. She's going to use the data she has from the sales of the first two cookies to figure it out so she puts it into a spreadsheet.
Susan's Cookie Business
| Cookie Type | Number of Cookies Sold | |||
|---|---|---|---|---|
| Week 1 | Week 2 | Week 3 | Week 4 | |
| Chocolate Chip | 672 | 675 | 861 | 862 |
| Oatmeal Raisin | 192 | 228 | 266 | 286 |
| Total per Week | 864 | 903 | 1127 | 1148 |
From this spreadsheet, Susan can now take the average of each week for all the cookies and bake her new that many of her new cookie. Here's the finished spreadsheet:
Susan's Cookie Business
| Cookie Type | Number of Cookies Sold | |||
|---|---|---|---|---|
| Week 1 | Week 2 | Week 3 | Week 4 | |
| Chocolate Chip | 672 | 675 | 861 | 862 |
| Oatmeal Raisin | 192 | 228 | 266 | 286 |
| Total per Week | 864 | 903 | 1127 | 1148 |
| Average per Week (Total/2) | 432 | 451.5 | 563.5 | 574 |
Susan may make too few or too many Peanut Butter cookies in the first 4 weeks, but once she sees how she is doing, she can adjust.