Work with Pivot Charts
Pivot charts let you create any ad-hoc report. Pivot charts are different from pivot tables in the following ways:
Pivot Chart vs. Pivot Table Definitions
| Element | Definition |
|---|---|
| Pivot chart | Flat table (not hierarchical) based on attributes you select. You can sort columns and rows, and you can drill down by selecting a specific cell in the chart. You can also see your data as a table, bar chart, stacked bar chart, horizontal bar chart, line chart, area chart, pie chart, scatter graph, or customize the output. |
| Pivot table | Table with a collapsible hierarchy, in which you can drill down to specific records. See Work with Pivot Tables. |
CCH Tagetik Supply Chain Planning can also add custom calculations should you need them.
To create a pivot chart
- In the left pane, click Pivot Chart.
- In the right pane, in each section, double-click the options you want to include in the chart:
Pivot Chart Options and Definitions
| Option | Definition |
|---|---|
| Data | Includes any element in CCH Tagetik Supply Chain Planning that can be reported on including, but not limited to, unit forecasts, dollar forecasts, and inventory metrics. |
| Breakout rows by | Category for each row, for example, attribute hierarchy, data elements, time line, units, etc. |
| Breakout columns by | Category for each column , for example, attribute hierarchy, data elements, time line, units, etc. |
| 3. To specify more information, in the toolbar at the top of the page, set the following parameters: |
Top Menu Toolbar Options
| Option | Description |
|---|---|
| Start | Type or select a date on which to start your report. |
| Horizon | Type a numeric value for the number of periods for the forecast and select one of the following: - Years - Halves - Quarters - Months - Weeks - Days - 4-4-5 |
| Scale | Select the scale for the values displayed: - % - 1 - 000 - 000,000 Values are always displayed as whole numbers. |
| Currency | Select a currency type for the values. Contact your CCH Tagetik Supply Chain Planning Administrator to add currency types. |
| 4. In the lower toolbar, set any of the following parameters: |
Toolbar Parameters
| Parameter | Procedure |
|---|---|
| Chart type | Select the style of table to display. Options include: - Table - Bar - Stacked Bar - Horizontal Bar - Line - Area - Pie - Scatter - Custom - Combination |
| Summarize by | Choose how you want the Data element you have selected to display: - Sum: Shows the sum of each row or column - Count: Shows the total number of records in that group - Average: Provides an average of data - Maximum: Displays maximum values - Minimum: Displays minimum values |
| Show as | - No calculation: Displays results with no calculation performed - % of row total: Displays x% of the entire row - % of column total: Displays x% of the entire column |
| Sort rows | Select how you want the rows sorted. |
| Sort columns | Select how you want the columns sorted |
| Edit Chart Properties () | Hide or show the right pane |
5. To generate your pivot chart, in the top toolbar, click the recalculate icon ( ). ). |
|
| 6. Click any cell to get a list of every record included by the cell's value. |
Pivot Chart Example
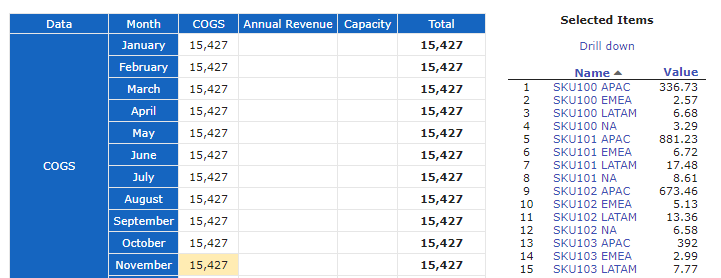
You can click any record in the Selected Items list to view or edit the record.
7. Depending on the chart type you selected in step 4, different options are available in this step. To
adjust table formatting options, click the gear icon ( ) and type or select from any of the options displayed. Click
OK when you want to see the results.
) and type or select from any of the options displayed. Click
OK when you want to see the results.
Pivot Chart Types
| Option | Description |
|---|---|
| Table Style List | Type or select any of the following options: - Maximum number of rows - Maximum number of columns - Include row totals - Include column totals - Include column subtotals |
| Graphic Style Charts include: - Table - Bar - Stacked Bar - Horizontal Bar - Line - Area - Pie - Scatter - Custom - Combination | For the graph style, you can change the Base Style with these options: - Bounding box - Vertical grid - Horizontal grid - X-axis - Y-axis - Log X-axis - Log Y-axis - Zero based Y-axis - Stacked sets - Legend - 3-D bars - Horizontal layout - Pie chart - Scatter plot You can also change series 1 through 4 with these options: - Area - Line - Point - Bar - Arrow - Value - Integer |
8. To switch the column and row headings, click the Transpose rows and columns icon ( ). ). |