Work with Pivot Tables
You can generate dynamic, time-based, rollup interfaces from forecasts or records and do the following:
- Customize the columns, which include adding new columns and editing existing columns.
- View different values side by side and build out any report structure you need.
- Create composite graphs for your data.
- Save pivot tables as views to help you quickly return to a pivot table and its graphs at any time.
See Create and Work with Views.
Totals that display in italics represent forecasted data.
Pivot Table Example
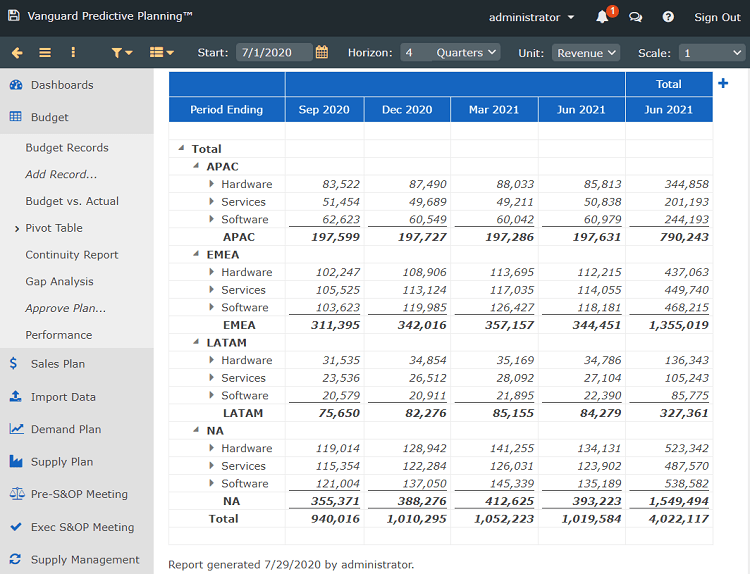
Note: DScript is supported in pivot tables. See the DScript chapters in Help for more information.
To work in a pivot table
- To specify the information to include, in the toolbar at the top of the page, set the following options:
Top Menu Toolbar Options
| Option | Description |
|---|---|
| Start | Type or select a date on which to start your report. |
| Horizon | Type a numeric value for the number of periods for the forecast and select one of the following: - Years - Halves - Quarters - Months - Weeks - Days - 4-4-5 |
| Scale | Select the scale for the values displayed: - % - 1 - 000 - 000,000 Values are always displayed as whole numbers. |
| Currency | Select a currency type for the values. Contact your CCH Tagetik Supply Chain Planning Administrator to add currency types. |
2. To compare with another pivot table or create a baseline, on the menu ( ), select one of the following: ), select one of the following: |
Pivot Table Options
| Option | Description |
|---|---|
| Compare To... | 1. In the Open screen, select an existing baseline and click Open. 2. To rename a baseline: - Select the baseline you want to rename and click Rename. - In the Rename screen, type a new file name and click OK. 3. To delete a baseline, select the baseline to remove and click Delete. |
| Create Baseline | 1. On the menu, click Create Baseline. 2. On the top toolbar, select the parameters listed in step 1. |
| Create Delta | - On the menu, click Create Delta. - On the menu, under Clear Delta, select one of the following: - % Percent - # Values To remove a delta, on the menu, click Clear Delta. |
| 3. To add or edit a column, do one of the following: |
Column Options
| Option | Description |
|---|---|
| Add a column | To the right of the top of the table, click the + icon. |
| Edit a column | Click the cell you want to edit (any blue cell at the top of the table). |
Edit Column Screen
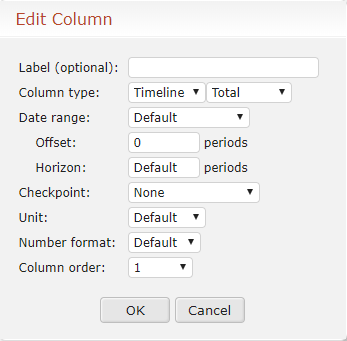
The parameters you set in the Add Column or Edit Column screen override the settings in the top toolbar (step 1). 4. In the Add Column or Edit Column screen, do the following:
Top Menu Toolbar Options
| Option | Description |
|---|---|
| Label (optional) | Type a label for the column. If you leave this cell blank, the system determines an appropriate label to use based on the information you select. |
| Column type | In the left list, select one of the following: - Timeline: Time-dependent series of numbers (current forecast, actuals, checkpoints, etc.) - Variance: Show difference between the last two timeline columns - Percent: Show differences between the last two timeline columns in percentages - Formula: Type a formula. For example: C2-C1 is equivalent to Variance. (C2-C1)/C1 is equivalent to Percentage. If expanded, the math between columns is done element by element. Displays according to whether you have selected Total or Expanded. Note: DScript is supported. See the DScript appendices for more information. - Blank: Inserts blank column for readability (groups of columns display together, separated by an empty column.) In the right list, select one of the following: - Total: Show only the final values - Expanded: Show monthly, quarterly, etc., values |
| Date range | Select one of the following: - Default: Uses the settings in the toolbars - Year to Date: Show values beginning at the start of the current fiscal year through the last complete period - Quarter to Date: Show values from the beginning of the current quarter to the last complete period Type the following: - In the Offset text box, type a value to shift the dates based on the period set in the Horizon For example, -12 periods would be 1 year prior if the period is monthly. -4 periods would be the prior year if the period is quarterly. - In the Horizon text box, type the number of periods that override what is set in the toolbar. |
| Checkpoint | Select an existing checkpoint, or select a module and version. Star option: Additional option for version. |
| Unit | Select an option - identical to unit in toolbar. Use Default to keep what is set in toolbar. Otherwise, these override what is set in the toolbar. Below are examples (except Default). May override if you want a pivot table to include multiple unit options. - Default - Units - Revenue - COGS |
| Number format | Percent, currency, etc. |
| Column order | Do one of the following: - Select a number for the order in which you want to see the column (1 being the first column in the report) - Click Delete to remove the column |
| 5. Click OK. | |
6. In the top toolbar, click the Recalculate icon ( ). ). |
|
| 7. To delete a column, do the following |
- Click the blue cell at the top of the column
- In the Edit Column screen, in the Column order list, click Delete.
- Click OK.
- To filter your report, on the toolbar, click the Record Filter icon (
 ), set the parameters you want and click
OK.
), set the parameters you want and click
OK. - To add or remove hierarchies, on the toolbar, click the Group Order icon (
 ), set the parameters you want and
click OK.
), set the parameters you want and
click OK.
You can drill down to specific records, and create graphs by hovering over the totals.
See Dock Graphs in Reports and Interfaces.
You can also download the interface to an Excel file, or create a view to save it for future use.
See Copy Forecast Data into Other Programs.
See Create and Work with Views. 10. To "zoom" in and see a specific time in more granularity (for example, to see months instead of years; to see weeks instead of months; or days instead of weeks), click the period in the second row of the heading in the table and it will show the next level of granularity. For example, if my table is shown by years and I click on Dec 2020, the months for 2020 now display. To go roll back to a period, click on the left arrow next to Period Ending at the beginning of the row.
Notice as you scroll through the table, the heading rows "stick" at the top of the screen so you can always see where you are.