Work with Custom Grid Interfaces
You can create customized grid interfaces where you can select the information you want to show and the order in which it displays. Custom grid interfaces can also contain virtual fields, which are calculated fields based on specific information stored within records. CCH Tagetik Supply Chain Planning offers some standard virtual fields, but you can request others for your specific use.
An example of a custom grid interface is for expected spoilage (run promo, transfer) available per warehouse location. This helps you know whether you need to place a new order or transfer from another warehouse. Customized grid interfaces help you quickly locate urgent items to streamline your daily workflow.
Custom grid interfaces are also useful for reports for specific audiences (for example, forecasters or buyers).
While you cannot save a view of your custom grid interface, you can download it to Excel.
To work in a custom grid report
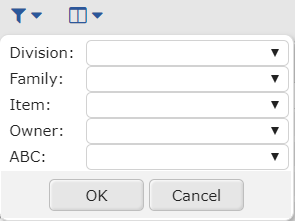
- In the top toolbar, click the filter icon (
 ),
select the attributes you want to include in your report and click OK.
),
select the attributes you want to include in your report and click OK.
Filter Options
 2. Click the field selection icon (
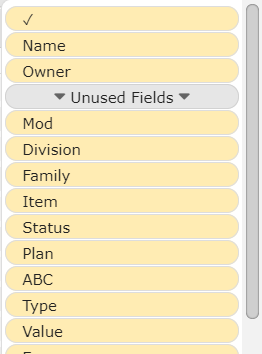
 ) and do any of the following:
Column Options
| Option | Procedure |
|---|---|
| To reorder columns | Select the column title you want to move and drag it to the desired location. |
| To show or hide columns | Select the column title you want to show or hide and drag it above the Unused Fields marker to include it in the report, or below the Unused Fields maker to hide it from the report. You can also double click on it to move it above or below the Unused Fields marker. |
Reorder Column Options
 3. Click OK.
4. To download the report to Excel, in the upper right of the screen, click the download icon
(
3. Click OK.
4. To download the report to Excel, in the upper right of the screen, click the download icon
(
 ).
).