Create Performance Interfaces
Within a module, you can compare two forecasts to see how your forecast is performing over time to review the accuracy of your forecasts.
Performance Report Interface
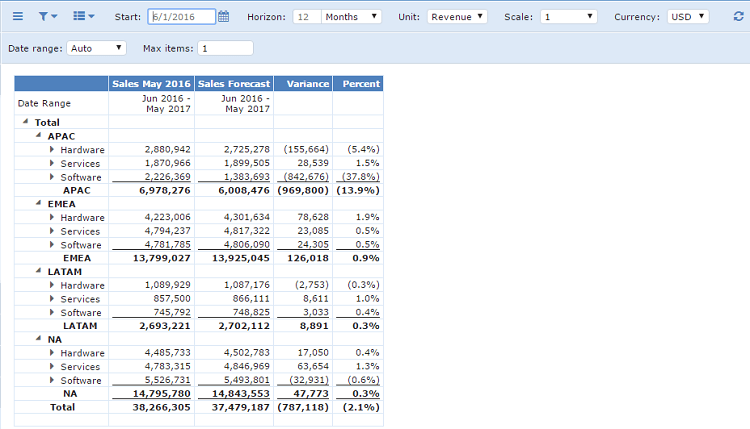
For example, say you created a Sales forecast in January 2016 for the next six months, based on the latest approved plan. Another plan was approved in March 2016. Using a Performance report, you could compare the forecast for the April-June 2016 period in both the January and March reports to see how closely your original forecast aligns.
See Approve a Plan.
To create a Performance interface
- In the top toolbar, set the following parameters:
Top Menu Toolbar Options
| Option | Description |
|---|---|
| Start | Type or select a date on which to start your report. |
| Horizon | Type a numeric value for the number of periods for the forecast and select one of the following: - Years - Halves - Quarters - Months - Weeks - Days - 4-4-5 |
| Scale | Select the scale for the values displayed: - % - 1 - 000 - 000,000 Values are always displayed as whole numbers. |
| Currency | Select a currency type for the values. Contact your CCH Tagetik Supply Chain Planning Administrator to add currency types. |
| 2. In the lower toolbar, set the following options: |
Lower Toolbar Options
| Option | Description |
|---|---|
| Date range | - Auto - Absolute - Relative |
| Max items | Type the number of items to include in the report. |
3. In the top toolbar, click the Recalculate icon ( ). ). |
You can drill down to specific records, and create graphs by hovering over the totals.
See Dock Graphs in Reports and Interfaces.
You can also download the interface to an Excel file, or create a view to save it for future use.
See Copy Forecast Data into Other Programs.
See Create and Work with Views.