Create Gap Detail Interfaces
Gap Detail interfaces let you compare your current system to checkpoints for a given date range.
See Compare Forecasts Over Time.
Gap Detail Report Interface
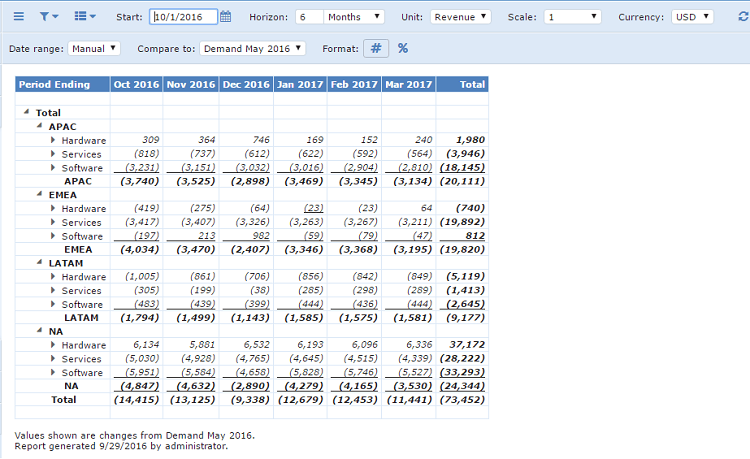
To create a Gap Detail interface
- In the top toolbar, set the following parameters:
Toolbar Parameters
| Parameter | Description |
|---|---|
| Total by | Depending on how your system is configured, you see different items. Following are examples: - Division - Family - Item - Owner - ABC |
| Sort by | Select how you want to sort your data: - Absolute value - Highest to lowest - Lowest to highest |
| Compare to | Select a time frame or checkpoint to compare your current data against. |
| Max items | Type the number of items to include. |
| 2. In the lower toolbar, set the following parameters: |
Toolbar Parameters
| Parameter | Description |
|---|---|
| Date range | - Auto: This is the default setting. It sets the Start date to the first day of the month in which your Compare to checkpoint began. - Manual: Select to adjust the Start date for the report. |
| Compare to | Select a checkpoint to compare the data against. |
| Format | - #: Show differences as values - %: Show differences as percent |
3. In the top toolbar, click the Recalculate icon ( ). ). |
You can drill down to specific records, and create graphs by hovering over the totals.
See Dock Graphs in Reports and Interfaces.
You can also download the interface to an Excel file, or create a view to save it for future use.
See Copy Forecast Data into Other Programs.
See Create and Work with Views.