Work with Triangle Interfaces
Triangle interfaces compare each month’s forecast to the checkpoints or approved plans loaded in CCH Tagetik Supply Chain Planning to measure forecast accuracy.
Triangle Interface Example
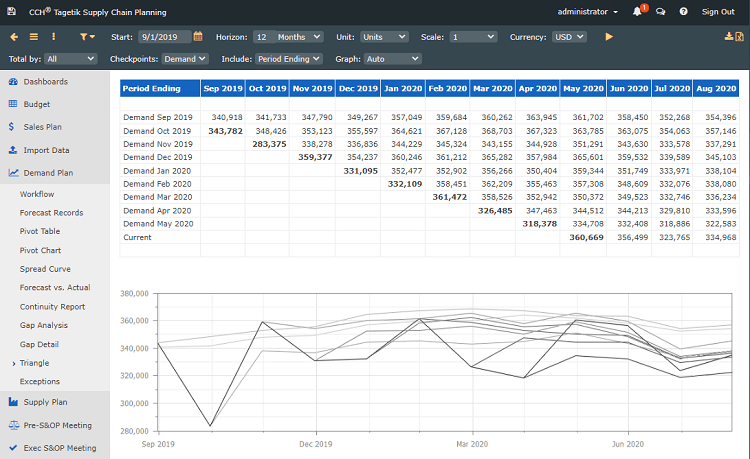
Bold totals in the interface are actuals, while other values are forecasts. The lighter the line in the graph, the further away it is from the checkpoint you selected. The line gradient shows how your forecast has evolved over time.
See Create and Work with Checkpoints.
See Compare Checkpoints.
See Approve a Plan.
To work in a Triangle interface
- To specify the information to include in the report, in the toolbar at the top of the page, set the following parameters:
Top Menu Toolbar Options
| Option | Description |
|---|---|
| Start | Type or select a date on which to start your report. |
| Horizon | Type a numeric value for the number of periods for the forecast and select one of the following: - Years - Halves - Quarters - Months - Weeks - Days - 4-4-5 |
| Scale | Select the scale for the values displayed: - % - 1 - 000 - 000,000 Values are always displayed as whole numbers. |
| Currency | Select a currency type for the values. Contact your CCH Tagetik Supply Chain Planning Administrator to add currency types. |
| 2. In the lower toolbar, set the following options: |
Report Options
| Option | Description |
|---|---|
| Total by | - All (default) - Properties configured for your instance - Individual |
| Checkpoints | Any checkpoints you have created. |
| Include | - Period ending (default) - All |
| Graph | - Auto (default) - Zero based |
3. In the top toolbar, click the Run icon ( ). ). |
You can drill down to specific records, and create graphs by hovering over the totals.
See Dock Graphs in Reports and Interfaces.
You can also download the interface to an Excel file, or create a view to save it for future use.
See Copy Forecast Data into Other Programs.
See Create and Work with Views.