Dock Graphs in Reports and Interfaces
You can create different views of data to show information to various individuals or groups of people. For example, you can create a delta report for a specific forecast and save that view to show later.
Graphs are available for all forecasts. You can dock one or more graphs and then modify them.
See Edit Graph Elements.
Dock Graph Example
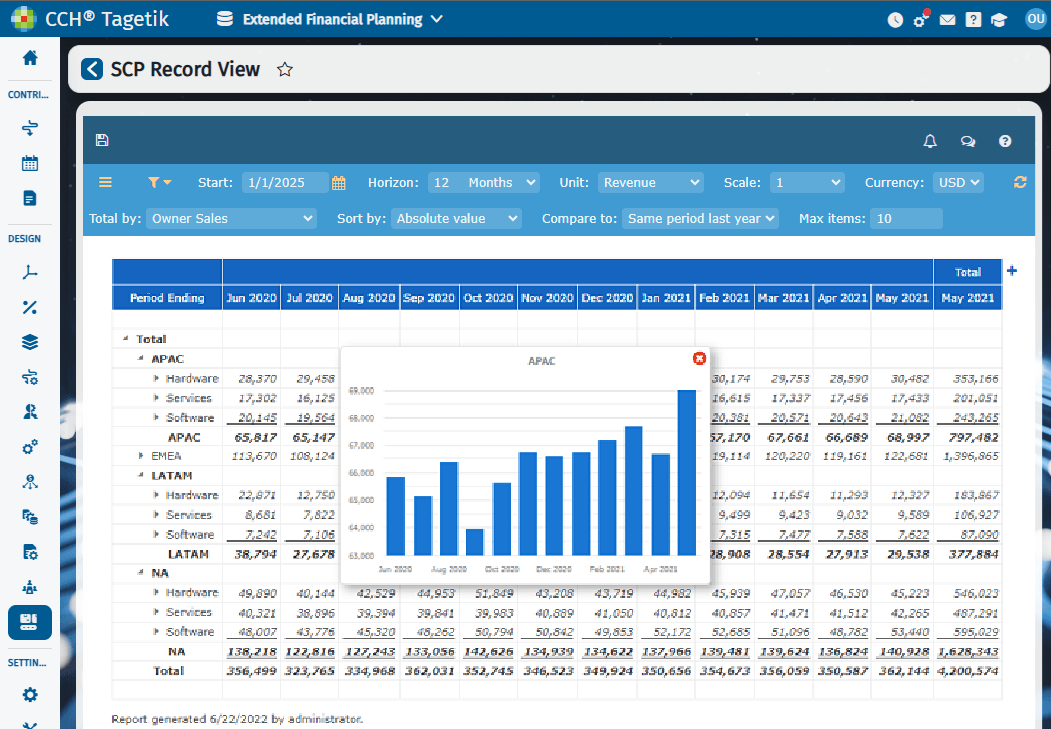
To dock a graph
- Hover over any forecast total.
- In the graph that displays, click and drag it above the report to dock it.
Dock Graph Example
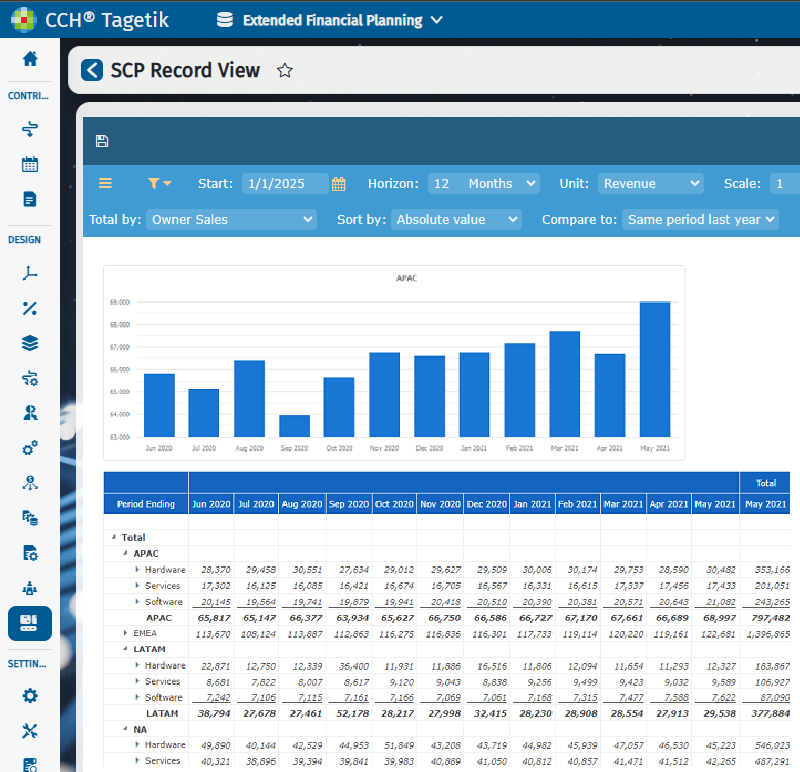
You can tile graphs by docking them to the left or right of the screen. 3. Repeat for any other graphs you want to dock.
- To cycle through each period of a report record's fiscal reports, double-click its graph in the dock area.
- To change the graph type, double-click a graph that corresponds to a value in the Total column.
- To remove a graph, drag it out of the dock area and click the close icon.