Use the Forecaster Performance Error Measure
You can use the Forecaster Performance error measure to determine whether forecaster manual overrides had a positive, negative, or neutral effect on the overall forecast accuracy. Since the automatic option is typically best, you should apply manual overrides only in specific cases, such as when a product is being discontinued, or a large order is pending.
Forecaster Performance Error Measure
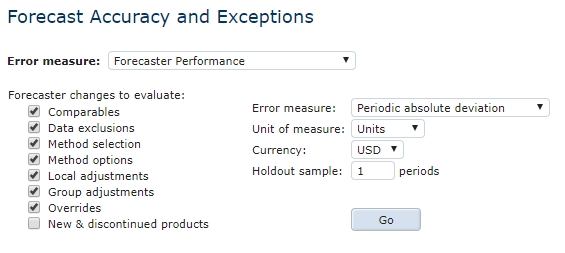
You can evaluate the effect on forecast accuracy of the following forecaster changes:
- Comparable items
- Data exclusions
- Method selection
- Method options
- Local adjustments
- Group adjustments
- Overrides
See About Error Measures.
To use the Forecaster Performance error measure
- In the left pane, navigate to an existing Exceptions report.
- In the main screen, on the Error measure list, click Forecaster Performance.
- Under Forecast changes to evaluate, check any change you want to evaluate.
The system removes any manually applied items you check and returns a comparison between what the system would have forecast without them and your adjusted forecast. This lets you determine whether the forecast was improved or weakened by the overrides. 4. Check New & discontinued products to include these items in your evaluation.
Typically, you would not include them as new items have no historical data and discontinued items are zeroed out. 5. On the Error measure list, select one of the following:
Error Measure List Options
| Option | Description |
|---|---|
| Periodic absolute deviation | Look at specific period data to see the difference in currency. For example, if you have a six month period, selecting this error measure would provide monthly data for each of the six months. |
| Total absolute deviation | Look at the total to see the difference in currency. For example, if you have a six-month period, selecting this error measure would provide the total data for the six-month period. |
| Periodic Symmetric percent error | Look at specific period data to see difference as a percentage. For example, if you have a six-month period, selecting this error measure would provide monthly data for each of the six months. |
| Total Symmetric percent error | Look at total (6 months, for example) to see difference as a percentage. For example, if you have a six-month period, selecting this error measure would provide the total data for the six-month period. |
| 6. On the Unit of measure list, select whether you want to see units or revenues (Revenue, COGS). | |
| 7. In the Currency list, select a currency type. | |
| 8. In the Holdout sample field, type a value for the number of periods CCH Tagetik Supply Chain Planning should | |
| remove from the historical data before preparing a fully automatic time-series forecast without any Forecaster Changes. |
CCH Tagetik Supply Chain Planning calculates the accuracies (based on the selected Error measure) of this automated forecast value, and the forecast value from the Forecast line in the record’s Adjustments and Overrides table.
The Percent error is the SMAPE. 9. Click Go.
Summary statistics display in the Top Exceptions table. Only Time Series Forecast records are included in this analysis, which typically represents a subset of the total records. Time Series Forecast records are excluded from the analysis if they contain no Forecaster changes.