Magnify or Exclude Historical Data in Forecast Graphs
There may be data points in the historical data for a product you want to exclude to prevent them from influencing the forecast. These data points might be the result of atypical fluctuations, such as a natural disaster or production problems. You can exclude these data points from the historical data of your forecast without deleting them from your data source. The changes are preserved when you save the record.
You can also magnify a section of a forecast graph to view data points in detail.
When you cut data points from the forecast (represented by the blue line), CCH Tagetik Supply Chain Planning resolves the timeline using the data points before and after the excluded data points. When data points are cut from the end of the historical timeline, the forecast shifts itself back to start at the latest uncut point. When data points are cut from the start of the historical timeline, the forecast ignores them entirely without replacing them.
You can also override historical data values directly in forecast graphs.
See Override or Exclude Historical Data in Forecast Graphs.
To magnify or exclude data points
- In a record, click a data point or click and drag your cursor over a section of the graph you want to magnify or exclude.
Magnify/Exclude a Data Point Example
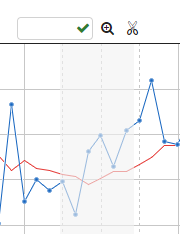
The selected section is highlighted in gray. To deselect a section you have highlighted, click anywhere in the graph.
If you select an endpoint, you will also have the option to exclude the data point and align the forecast.
Magnify/Exclude a Data Point Example
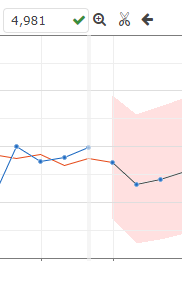
This rolls back your forecast. 2. Release your cursor and, at the top of the graph, select one of the following:
- Zoom icon (
 ) to magnify
 - Cut icon (
 ) to exclude the data point
 -
Arrow icon (
 ) to
exclude the data point and align the forecast
) to
exclude the data point and align the forecastThe graph reloads with a green line, which represents the data points you excluded.
Magnify/Exclude a Data Point Example
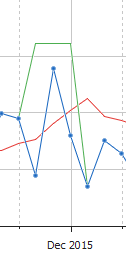 3. To return to the unedited view, at the top right of the graph, click Clear Exclusions.
The excluded data point is restored to the forecast.