Run drill down
Introduction
The various drill down modes and their specific features are described below.
Standard drill down
This mode allows you to select the aggregation structures and dimensions to be used to view the composition of data. It generally makes sense to run drill down on the aggregation structures on which basis the data was aggregated (the dimensions currently used in the selected cell are shown in yellow in the list).
Once the user has selected the aggregation structure on the basis of which the drill down is to be run, they can specify whether it should be run on all child elements or on the lowest level elements only.
Example 1
The following hierarchy groups entities by geographic area and the Europe node is selected as a filter for the entity dimension. The hierarchy appears as below:
- Europe
- South Europe
- Italy
- Spain
- Greece
- North Europe
- UK
- Germany
- France
- North America
- United States
- …
- …
- Canada
- ...
- …
If the user runs the drill down on the child elements, the system shows the overall data for the South Europe and North Europe nodes. If the user runs the drill down on the lowest level elements, the system shows the data for Italy, Spain, Greece, UK, France and Germany.
Example 2
In this example, the Excel file shows the account for sales revenue produced by Europe, a Regional View hierarchy that groups entities by geographic area and a Product types hierarchy that groups products by type. If the user runs the drill down on the child elements of the Regional View hierarchy, the system displays the data distributed among the countries of the Europe area. If the user also runs the drill down on the lowest level elements of the Product Types hierarchy, the system displays the data for the individual products of a given type.
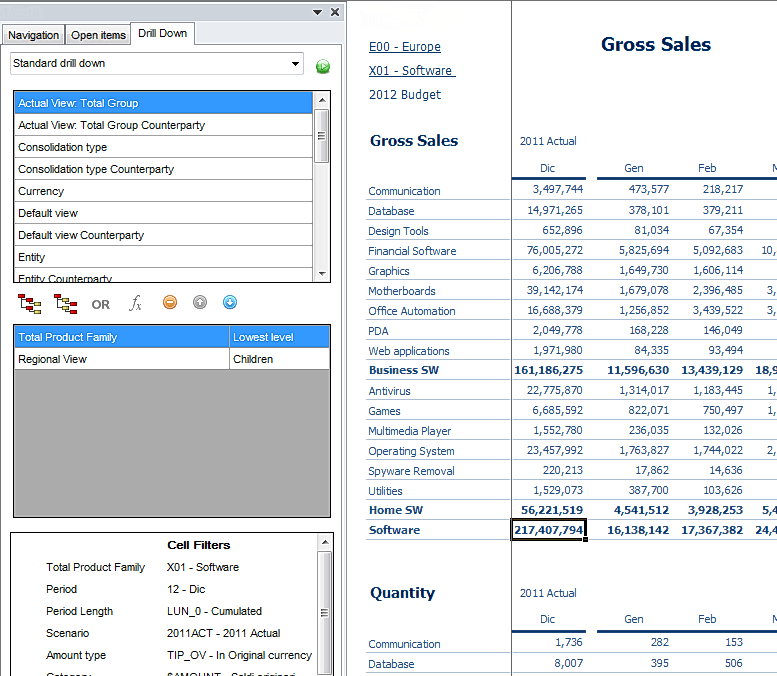
Those figures are shown in this second Excel sheet, which can be saved.
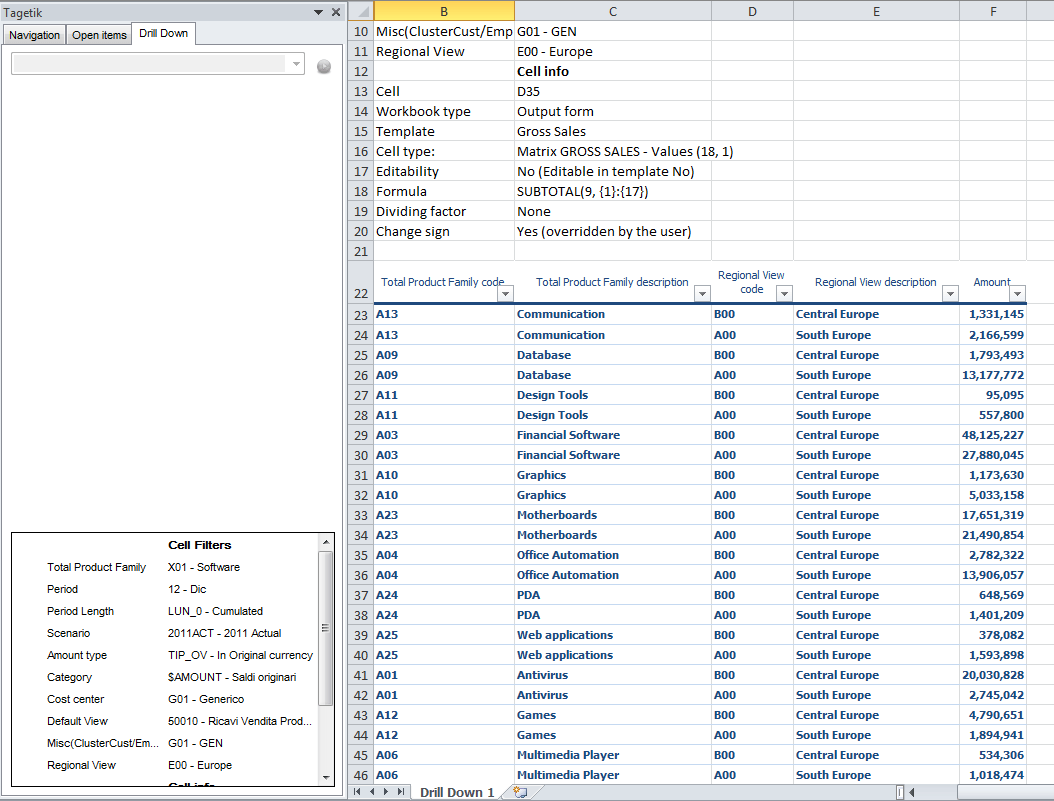
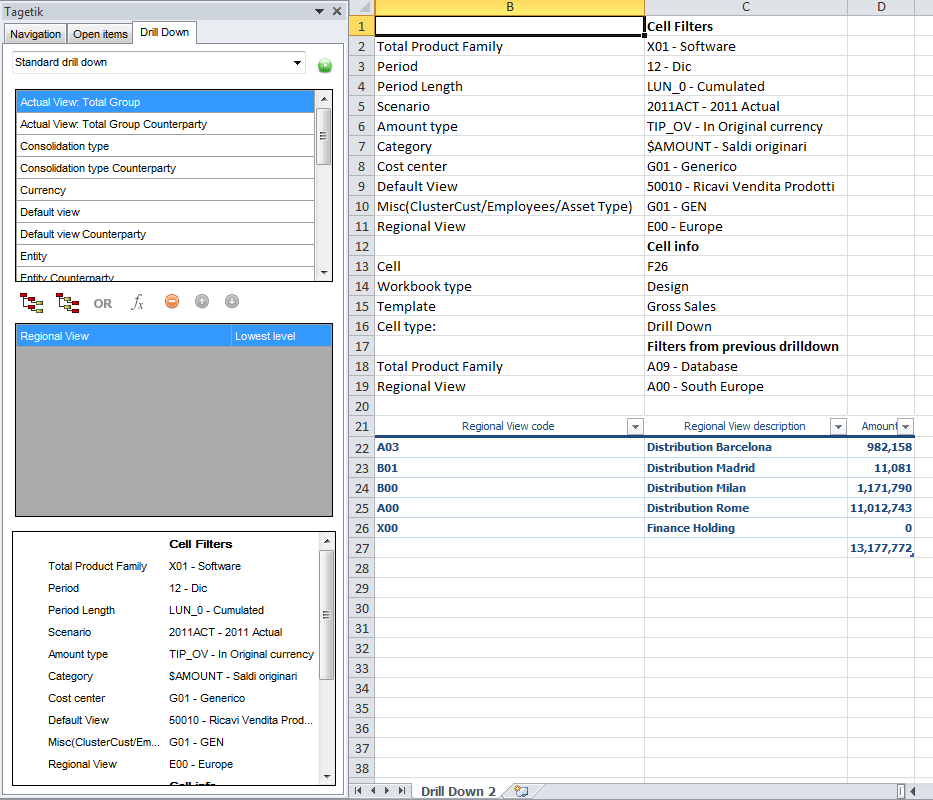
The system exports, in two different columns, the code and description of the elements of the tables on which it ran the drill down. Thus, it also allows you to reorder the rows based on the description. In this specific example, it is possible to continue the drill down to see the distributed data for the countries of south Europe and central Europe, for example.
Note: if several drill downs have been performed, it is possible to navigate between "Drill down" sheets.
"OR" drill down
This mode allows you to see details of the contributions to the value corresponding to OR row/column filters, if present.
Formula drill down
This mode is activated using the button  in the drill down column and is only available on cells related to FST items that can be related or formula-type FST items. Shows the individual accounts that make up the FST item.
Calculation details
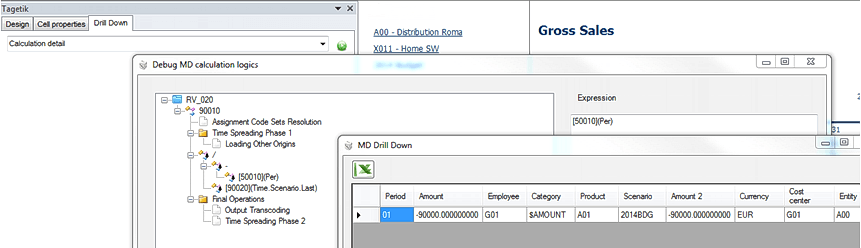
This mode allows you to obtain any basic accounts calculation logic that has fed the account defined in the selected cell and shows the following:
- if the adopted calculation logic type is Sum, the individual addenda already multiplied by the appropriate coefficient
- if the adopted calculation logic type is Multi Dim. Script, the syntax tree of the calculated account
The following conditions are necessary to see such information:
- The accounts calculation logic type must be Sum. This allows you to see the values of the individual addenda multiplied by the appropriate coefficient. The system only supports the simple case, in which only the account, and no other dimensions, is filtered on input. Moreover, only one calculation logic must be defined for the account on which drill down is being run. The output of the drill down always applies the filters of the starting form, except for the filter on the account, and ignores any filters originating from overrides.
- The accounts calculation logic type is Multi Dim. Script. In this case, the system shows the syntax tree of the calculated account in a new window.
- The cell only contains one account/category. That account must not have been generated by several accounts with the Sum or Multi Dim. Script calculation logic types with the same account as the outcome. In fact, in such cases the system would not know which account to show during the drill down.

To see all the available details, including the amounts of the various components, double click on the individual addenda and lowest level elements of the syntax tree shown. To see the calculation logic that generated the account present in the cell in question, simply click  Cell properties, see Design toolbar.
Lowest level elements: Dimensions
In the presence of aggregated data, this mode shows the figures for the individual elements of all dimensions for which the cell's current value has been aggregated.
Example
Applying the Lowest level elements: Dimensions mode to the previous example allows us to see the figure for each individual European country and for each individual software product. Standard drill down should therefore be run on the lowest level elements of the Budget View hierarchy and on the lowest level elements of the Product Types hierarchy.
System query [query name]
This mode allows you to run an SQL query defined by an administrator user and then run the drill down on information that has been stored in other tables of the CCH Tagetik Data Model. See Query.
This mode is not supported in AIH.
Headers
This mode allows you to run the drill down on the origin of changes made to a value. This allows you to revise the final value of a number stored in CCH Tagetik. This mode is not supported in AIH
Adjustment detail:
This mode provides more details than are shown with Headers adjustments, such as the user that made the adjustment and the date and origin of the adjustment. It therefore makes the final value fully traceable.
This mode is not supported in AIH.
Drill-down on Consolidation Scenarios
When a user performs a drill-down on a consolidation scenario, the displayed data may sometimes not match the original value of the selected cell.
In such cases, it is advisable to check the category filter applied to the scenario in the data model, as it may be the source of the discrepancy.
To perform this check, go to the Exception > Category Filter section on the consolidation scenarios page.
From this page, you can define which categories are allowed as input for consolidated data.
If some of the categories expected in the drill-down are missing from the filter, it is recommended to add them manually.
Once the filter has been updated, simply rerun the report and the drill-down to verify whether the issue has been resolved.
Unsupported features
Cell drill-down on placeholders containing formulas inserted through the matrix wizard is enabled both in AIH and in the Financial Workspace. However, there are some unsupported scenarios—for example, cases where the formula refers to numerical values and/or elements outside the matrix.