Working on visuals
Create a visual
CCH® Tagetik > Report & Analysis > Browse all > Select a dashboard >  > visual button
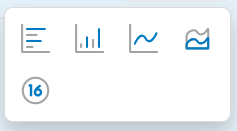
- Click on Add button on the dashboard to open the visuals list pop-up page
- Click on the icon of the desired visual
 to open the Object settings window
 - Configure Object Settings Tab Data, see Object Settings Tab Data
- Configure Object Settings Visualization Tab , see Object Settings Tab Visualization
Moving a visual
CCH® Tagetik > Report & Analysis > Browse all > Select dashboard > select visual
- Click on the visual
- drag and drop it to the desired position
Note: Each visual created will be 4x4 in size and will occupy the first available space of that size
Resize a visual
CCH Tagetik > Report &Analysis > Browse all > Select a dashboard > Select a visual
- Select a visual
- Click on corners or sides of the visual to enlarge or reduce the size

IMPORTANT: the visual size adapts to the zoom of the web page
Edit a visual
CCH Tagetik > Report &Analysis > Browse all > Select a dashboard > Select visual >  > Edit
- Click Edit
- Add link Object Setting Data Tab and add link Object Setting Visualization Tab
Delete a visual
CCH Tagetik > Report &Analysis > Browse all > Select a dashboard > Select visual > > Delete
- Click Delete to open the visual deletion window
- Click again on Delete to confirm the deletion
- Click Close to cancel
View a chart in full screen
CCH Tagetik > Report &Analysis > Browse all > Select a dashboard > Select visual > > View in full screen
- Click View in Full Screen
- Click Esc to exit full screen mode
IMPORTANT: only available for already configured visuals of Bar/Column/Area/Line type
Download a visual
CCH Tagetik > Report &Analysis > Browse all > Select a dashboard > Select visual > > Download
- Choose the file format
- Click on the format type
IMPORTANT: only available in png, jpeg, pdf, svg, csv, xls formats.
IMPORTANT: only available for already configured visuals of Bar/Column/Area/Line type
Displaying the Data Table of a Chart
CCH Tagetik > Report &Analysis > Browse All > Select Dashboard > Select Visual > > View Data Table
- Click on view data table
- Click on Hide Data Table to hide the data table and display the chart
IMPORTANT: only available for already configured visuals of Bar/Column/Area/Line type