Spreading methods in data entry mode
Introduction
The methods used in the application of the spreading calculation are provided below, with examples.
Examples of the application of spreading on the annual sales volumes forecast
In these examples, the following annual sales volumes for the Antivirus product are present in the database.

The sales forecasts for the subsequent year double in value, from 1200 to 2400 units. Details of the provisional data depending on the forecasting method are provided below.
Proportional spreading
Calculates how to subdivide the total value based on the monthly values existing on the application database, namely according to the values with which the form was generated.

Uniform spreading
Distributes the total value equally over the number of periods to which the total value refers.

4-4-5 / 4-5-4 / 5-4-4 spreading
Distributes the total value over the number of weeks in a month, for quarterly groups. For example, 4-4-5 applied over the quarter from January to March indicates that January and March have 4 weeks, while March has 5 weeks.
The number of weeks in each month depends on the calendar used, for which the system takes account of any months made up of more than 4 weeks, forecasting higher sales in those months. In the example, the volumes of sales in the third month of every quarter (therefore March, June, September and December) are higher than the other months.

On the contrary, using the 4-5-4 method, the volumes of sales are higher in the second month than the other months.
Customised spreading
Allows you to specify a customised distribution rule for the total value over the periods. The user freely adds the rule to be used. For example, the following data will be obtained if a 5-4-4-5-4 rule is defined:

In the definition window, every weight must be entered after the separator ";".
Spreading based on scenario
Allows you to distribute the new value based on the values present on another scenario, from among those linked to the current scenario, so that the possible seasonal variation of real data can be monitored.
The scenario 2011ACT values are provided below.

The value distribution of 2400 on scenario 2012BDG, based on the previous scenario 2011ACT values, is as follows:

Example of spreading on totals
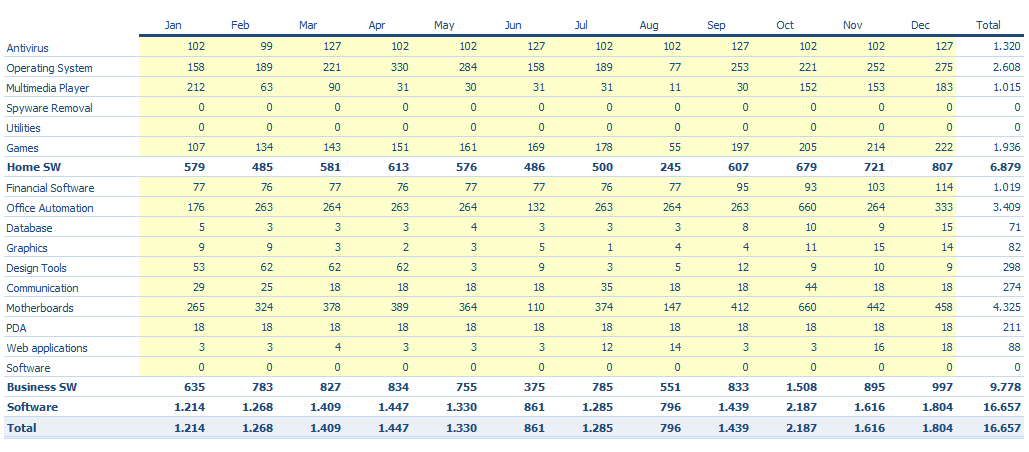
Spreading can also be calculated in complex forecast forms, the totals of which are calculated on the basis of the subtotals. In this example, the form has the following structure:
- it has the subtotals by product on the rows
- it has the subtotals of the volumes of sales for the various months on the columns
- a total with the sum of the two subtotals
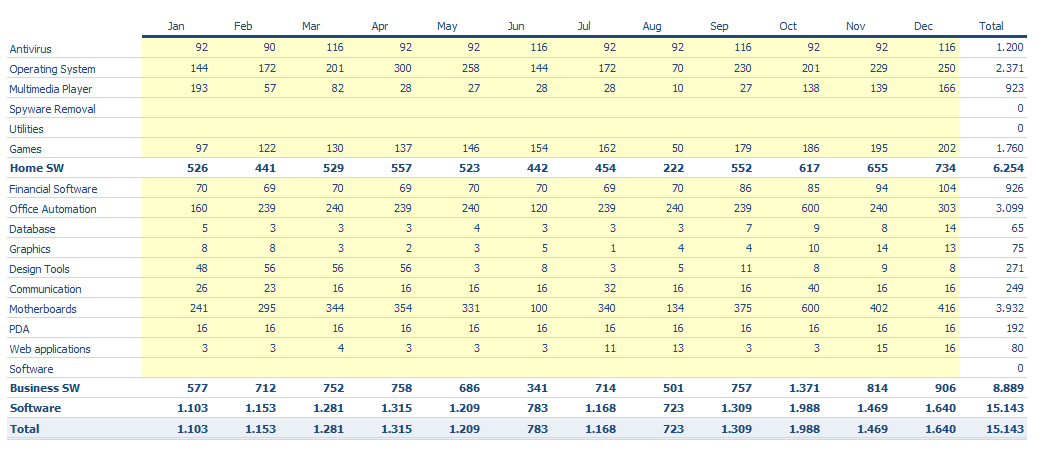
In a form with this structure, editing subtotals or the total brings about the following behaviours:
- editing the total sales value means that the new value will be distributed over all products and months based on the spreading method set on the form, and recalculates the subtotals.