Work with Exceptions Interfaces
Exceptions interfaces provide you with error measures to assist you in determining the accuracy of your forecasts, and in resolving any forecasting errors.
Exceptions Interfaces
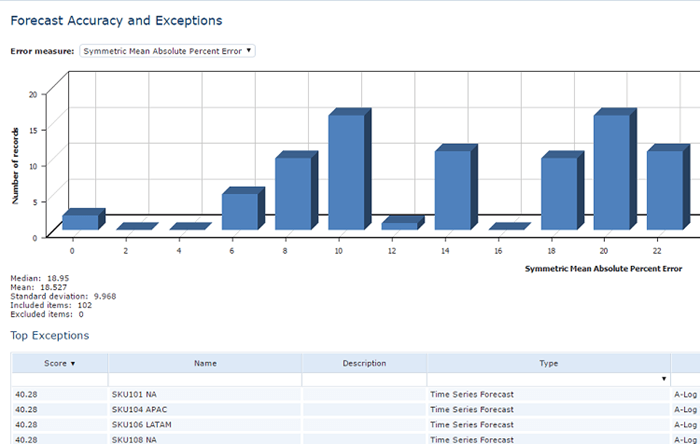
The Exceptions interface contains the following sections:
Exception Interface Sections
| Section | Description |
|---|---|
| Error measure graph | Useful for seeing the accuracy of your forecasts. It contains the number of records at each measure of a specific error measurement. Below the graph are statistics for the median, mean, and standard deviation of the error measure across all records. See About Error Measures. |
| Top Exceptions table | The Top Exceptions table displays all of the records according to the error measure selected. The records having the largest error measure are listed first. See Use the Top Exceptions Table. |
You can use exceptions and error interfaces to determine the overall accuracy of your forecasts, and to review any records that might be negatively influencing your forecasts and reports. All record owners should periodically review their records, especially after making any major changes to a forecast, such as a significant update to historical data.
A record may negatively influence another record for which it is used as an adjustment, or where it is used in a formula. The errors reported in the Exceptions interface lets record owners see if another record is negatively influencing their records. In these cases, a user can leave notes about the errors for the record owner.
See Propose Changes to a Record.
To work in an Exceptions interface
-
In the main screen, on the Error measure menu, select one of the following error measurements:
-
Symmetric Mean Absolute Percent Error
- Mean Absolute Percent Error
- Mean Absolute Deviation
- Mean Absolute Deviation Percent
- Bias Percent
- Last Absolute Deviation Z-Score
- Quality Score
-
Forecaster Performance
The error measurement graph and Top Exceptions table change to display the results of the error measurement you selected.
See About Error Measures. 2. In the Top Exceptions table, select the record you want to view and make any modifications necessary to correct the error.
See Use the Top Exceptions Table 3. Once you have made your changes, in the upper-right of the screen, click Next. 4. In the Keep Changes screen, click Yes. 5. To copy the Error measure graph:
- Right-click the graph and click Copy image.
- Paste the graph into another application, such as an email program.