Edit Graph Elements
You can add or remove the following graph elements:
- Fitted line
- Historical line
- Confidence interval
You can also change the period the graph displays (Mo, Qtr, Yr), and the forecast range.
To edit graph elements
- In a record, hover over the bottom-right corner of the graph to reveal the graph’s display options:
Edit Graph Elements
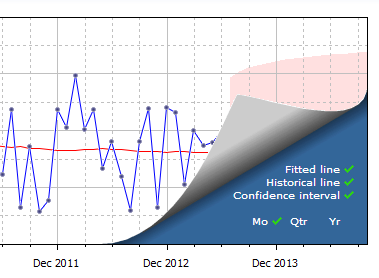 2. Click an option to select or deselect it.
To modify the forecast range
- At the bottom of the graph, hover over a date and drag the date axis to the right or left.