About Forecasting Methods
When you import or manually type your historical data into a forecast, CCH Tagetik Supply Chain Planning uses a proprietary algorithm to evaluate and rank each available forecasting method. The top-ranked method is the one CCH Tagetik Supply Chain Planning has determined to be the most appropriate for your data.
Method Section of a Record
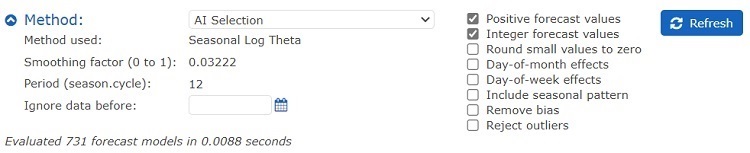
In most cases, you receive very good forecasts using the AI Selection method, which lets the Forecast Engine select the best method and parameters. CCH Tagetik Supply Chain Planning selects the method likely to produce the lowest prediction error (MAD/sqrt(n)) over the near-term horizon using a variety of statistical analyses, in-sample testing, and an expert system ruleset.
CCH Tagetik Supply Chain Planning does not necessarily select the method that “fits” historical data the best as this often results in erratic forecasts. Once a method is selected, the parameters for that method are chosen to minimize the one period forward MAD over history.
The Automatic method selection algorithm in CCH Tagetik Supply Chain Planning favors a simple model over a complex one and uses holdout sample testing to measure effectiveness based on the following principals:
- Historical data contains a mix of signal and noise. The purpose of most Time Series forecasting methods is to filter out the noise to better identify the signal. Historical data is noisy.
- If you over-fit a forecast (use a method that captures features that do not exist in the signal), you capture noise in addition to signal and extrapolate that noise.
- You can always fit history better by over-fitting; the more degrees of freedom you have in a model, the more closely you can match the bumps in historical data. However, an over-fit forecast produces bad results.
- Method selection is not about finding the best fit method; it is about finding the best predictor.
- Historical fit is not necessarily a good measure of prediction ability. Holdout sample testing is the gold standard. It lets you test a method’s prediction ability by simulating the use of the method in the past, that is, withhold some of the historical data and measure how well the forecast method predicts the holdout sample using only the truncated historical data set.
In the Method section, the forecasting method used by CCH Tagetik Supply Chain Planning is listed. CCH Tagetik Supply Chain Planning generates forecasts automatically by analyzing the data for trends and patterns and applying the best method.
You may want to override the method or parameters if you find the Automatic method is not detecting characteristics you know exist. This is most common in the detection of seasonal patterns when you have insufficient historical data for the Forecast Engine to determine conclusively that these patterns exist.
CCH Tagetik Supply Chain Planning provides you with multiple forecasting methods. You can apply any of these methods to your data and generate your own forecasts. When you select a new method, it is applied to the forecast immediately. There are additional parameters, such as maximum frequency, for some methods. The available methods are described below.
Forecast Methods
| Method | Seasonal | Trend |
|---|---|---|
| Vanguard dampened trend See About Hybrid Methods. | Yes | Power |
| Seasonal Vanguard dampened trend | Yes | Power |
| Log Theta See About Hybrid Methods. | Yes | Exponential |
| Seasonal Log Theta | Yes | Exponential |
| Theta See About Hybrid Methods. | Yes | Linear |
| Seasonal Theta | Yes | Linear |
| ARIMA (Box-Jenkins) | Yes | Exponential |
| Seasonal ARIMA (Box-Jenkins) | Yes | Exponential |
| Winters' multiplicative season | Yes | Linear |
| Winters' additive season | Yes | Linear |
| Holt's linear method | No | Linear |
| Simple exponential smoothing | No | None |
| Croston's intermittent demand | No | None |
| Vanguard Additive decomposition With additive decomposition, data is adjusted with seasonal effects in mind so that it averages out to 0. Once a trend is estimated, trend estimates are subtracted from the series. From this number, seasonal factors are estimated and then the random or irregular component can be determined (random = series - trend - seasonal). The random component is then used to analyze for further equations. | Yes | Quadratic |
| Vanguard Multiplicative decomposition | Yes | Quadratic |
| Vanguard Sigma A Wolters Kluwer-proprietary algorithm that lets you forecast at a low level that allows a better view of the combined records. | Yes | Quadratic |
| Recurring revenue Lets you automate revenue that is predictable, stable, and highly likely to continue from year to year. Examples include subscription renewals and monthly payments. This is a model-based method. You can set one of the following Parameters: - Automatic: The system fits the data. - Manual: You can type the values you expect (a value of 1 is equal to 100%). | Yes | Power |
| Moving average | No | None |
| Random walk (Naive) | No | None |
| Seasonal random walk Lets you set a recurring value based on a time frame. For example, October 2017 picks up values from October 2016. This is useful for recurring expenses (such as insurance payments, employee bonuses, and products with yearly subscription renewals) that always occur on the same date and are always the same value. | Yes | None |
| Random | No | None |
| Linear regression | No | Linear |
| Linear trend: y(x)=a+bx | No | Linear |
| Hyperbolic trend: y(x)=a+b/x | No | Hyperbolic |
| Logarithmic trend: y(x)=a+b*log(x) | No | Logarithmic |
| Square root trend: y(x)=a+b*sqrt(x) | No | Square root |
| Quadratic trend: y(x)=a+bx^2 | No | Quadratic |
| Power trend: y(x)=a*x^b | No | Power |
| Exponential trend: y(x)=a*e^(bx) | No | Exponential |
| Seasonal trend | Yes | Linear |
| Lowpass filter See About Spectral-Analysis Techniques and Apply Spectral-Analysis Filters. | Yes | Linear |
| Spectral noise filter See About Spectral-Analysis Techniques and Apply Spectral-Analysis Filters. | Yes | Linear |
| Formant frequency See Apply Spectral-Analysis Filters. | Yes | Linear |
| Zero | No | None |
Note: Additional methods may be added to your CCH Tagetik Supply Chain Planning implementation.
There are also additional settings you can apply to refine your forecast.