About Spectral-Analysis Techniques
Cyclical data sometimes benefits from the application of more refined smoothing and filtering to better illustrate seasonal trends. The examples below show how applying spectral analysis techniques can provide a clearer understanding of seasonal fluctuations.
For data that is cyclical, spectral-analysis techniques may filter noise out of sample data better than a simple curve fitting or data smoothing. For example, consider the monthly sales data illustrated in this figure:
Simple Curve
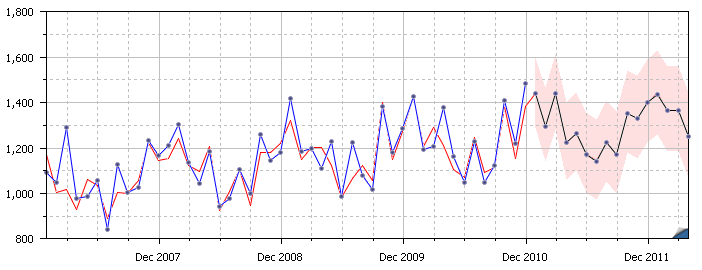
It might be difficult to notice the seasonal fluctuations at first. However, fit a trend to the data that is calculated using the Lowpass filter and the seasonal fluctuations stand out:
Lowpass Filter
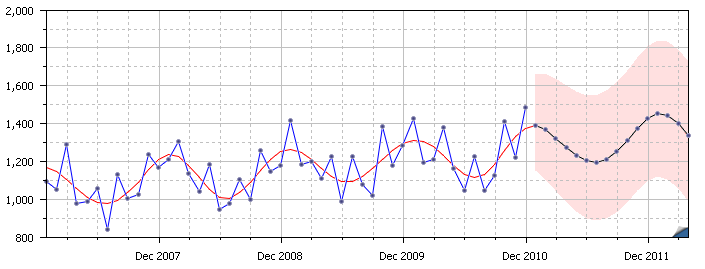
The spectral-analysis filters (Lowpass filter, Spectral noise filter, and Formant frequency) filter your data using a Fourier transform technique that lets the filter work in the frequency domain rather than the time domain. This is similar to what a spectrum analyzer does when it breaks sound waves into frequency components.
In short, the theory behind spectral concepts is that any sample of data points can be broken down into a sum of sine waves of different frequencies. If you use enough sine waves (one for every two data points), the sum precisely matches your original data. Instead of thinking about your data's value at specific points in time, you can now think about your data's spectral content over all time.
If the number of data points in your original sample is a power of two, (e.g., 16, 32, 64, 128, 256, n2, etc.), the frequency components are calculated using a Fast Fourier Transform (FFT) algorithm. For any other number of data points, a Discrete Fourier Transform (DFT) algorithm is used. The FFT and DFT algorithms produce the same results; however, if you have more than 50 data points, the FFT algorithm is significantly faster.
Spectral-analysis filters are great tools to look for patterns in your data. However, as with any forecasting method, their use should be based on more than just the MAPE. By controlling the user-supplied parameters, you can design spectral-analysis filters to have extremely low MAPE values (close to 0%), which indicates a perfect fit to the historical data. The problem is the future, which is what will be forecasted, will not be an exact match to the past. Therefore, the spectral-analysis filters are often poor forecasting methods when controlled by the user to manipulate the MAPE.